Beyond Rankings: LET Performance Trends
Analyzing the Philippines' Top 10 LET performers from 2018–2023 to uncover institutional dominance, geographic patterns, demographic trends, and consistency in examination performance.
Beyond the Rankings
This project analyzes the Top 10 LET passers in the Philippines from 2018 to 2023 to identify patterns in institutional performance, regional representation, demographics, and examination ratings.
Rather than treating board examination rankings as isolated results, the study applies descriptive analytics to transform ranking records into measurable trends that can support evidence-based comparisons across universities and regions.
Dataset at a Glance
The analysis combines board examination rankings, institutional information, geographic classification, demographic data, and examination ratings.
How I Analyzed the Results
Multiple descriptive techniques were used to examine institutional frequency, demographic distribution, geographic concentration, and changes in performance over time.
Count
FREQUENCY ANALYSISMeasured how frequently universities appeared among the LET Top 10 performers across examination periods.
Compare
TREND ANALYSISExamined changes in average examination ratings across the observed years and testing periods.
Measure
DESCRIPTIVE STATISTICSCalculated mean, median, mode, variance, standard deviation, and range to quantify performance.
Map
GEOGRAPHIC ANALYSISCompared Top 10 representation across Luzon, Visayas, and Mindanao to identify regional concentration.
What the LET Data Revealed
The findings reveal clear institutional, demographic, geographic, and performance patterns across the observed period.
Top Performing Universities
Insight: University of Mindanao – Davao City recorded the highest frequency with 50 Top 10 appearances, followed closely by USEP Tagum and USEP Davao.
Gender Distribution
Insight: Female performers represent 64.1% of the observed Top 10 population.
Distribution by Island Group
Insight: Mindanao accounts for 55.6% of observed Top 10 placements, substantially exceeding Luzon and Visayas.
Private vs Public Schools
Insight: Private schools account for 52.9% and public schools 47.1%, indicating a relatively balanced distribution.
Performance Consistency
Insight: The relatively low standard deviation indicates consistent performance among top-ranked LET candidates.
Average Rating Trend: 2018 to 2023
Insight: Performance remained relatively stable across examination periods, with October 2022 recording the highest observed average rating.
Where Top LET Performers Come From
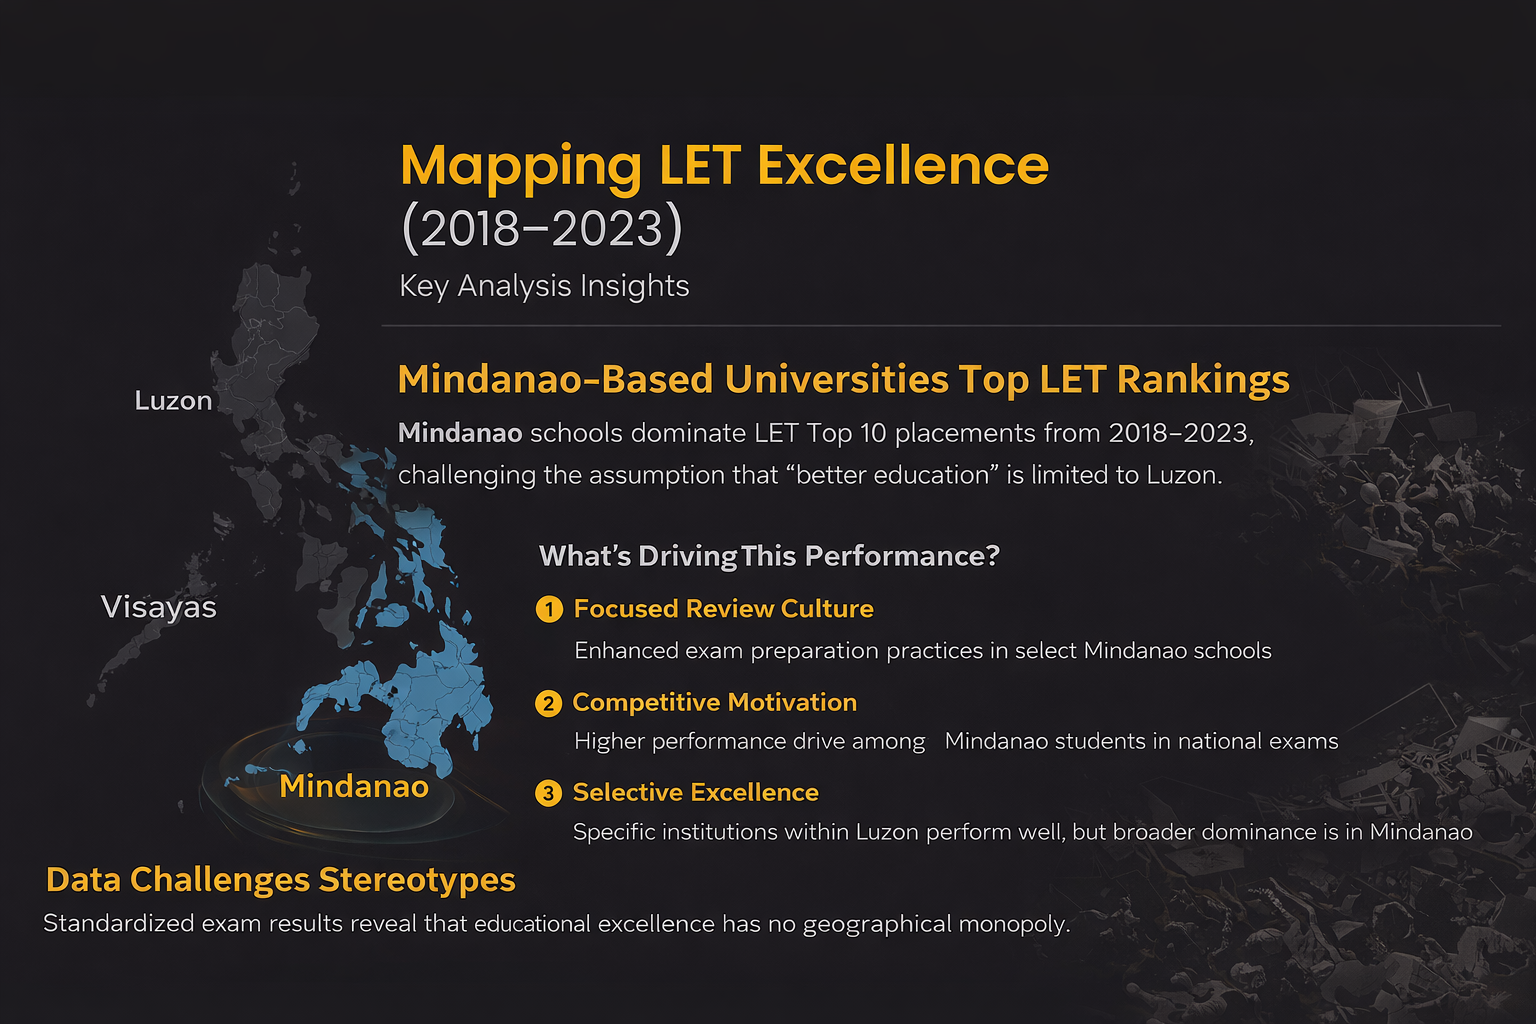
Regional distribution reveals a strong concentration of Top 10 placements among Mindanao-based universities during the analyzed period.
Top 10 LET Placements
Mindanao leads Top 10 representation.
Mindanao-based universities account for more than half of the observed Top 10 LET placements, substantially exceeding both Luzon and Visayas during the analyzed period.
This finding challenges the assumption that strong board examination performance is concentrated primarily among institutions located in major Luzon urban centers.
From Rankings to Evidence
The findings show why educational performance should be evaluated using measurable outcomes rather than assumptions based solely on geography or institutional prestige.
Data Over Stereotypes
LET performance data challenges the assumption that educational excellence is automatically concentrated in major urban institutions.
Benchmark Best Practices
Institutions can study the preparation strategies and academic support systems of consistently high-performing universities.
Inform Policy Review
Regional education authorities can use performance evidence to identify programs and practices that may contribute to stronger outcomes.
Go Beyond Rankings
Future studies should combine ranking data with overall passing rates, faculty credentials, resources, and student demographics.
Educational quality should be measured through evidence, not geography or reputation alone.
The LET Top 10 data demonstrates that high-performing candidates and institutions emerge across regions, with Mindanao showing particularly strong representation during the analyzed period. Rankings provide one useful signal, but stronger conclusions require combining them with broader indicators of educational quality.