Spending Behavior Analysis
Exploring customer spending patterns, identifying behavioral segments, discovering purchasing relationships, and forecasting future transaction trends.
Project Overview
This project analyzes credit card transaction data to uncover customer spending patterns, identify meaningful market segments, and forecast future spending behavior.
Rather than simply reporting transaction totals, the analysis combines exploratory analytics, machine learning, association rule mining, and time-series forecasting to transform raw financial data into actionable business insights.
Dataset at a Glance
The dataset combines transactional, categorical, temporal, and customer demographic information.
How I Analyzed the Data
Four analytical approaches were combined to move from exploration to customer segmentation, pattern discovery, and forecasting.
Explore
EDAExamined transaction distributions, spending behavior, demographics, categories, and temporal patterns.
Segment
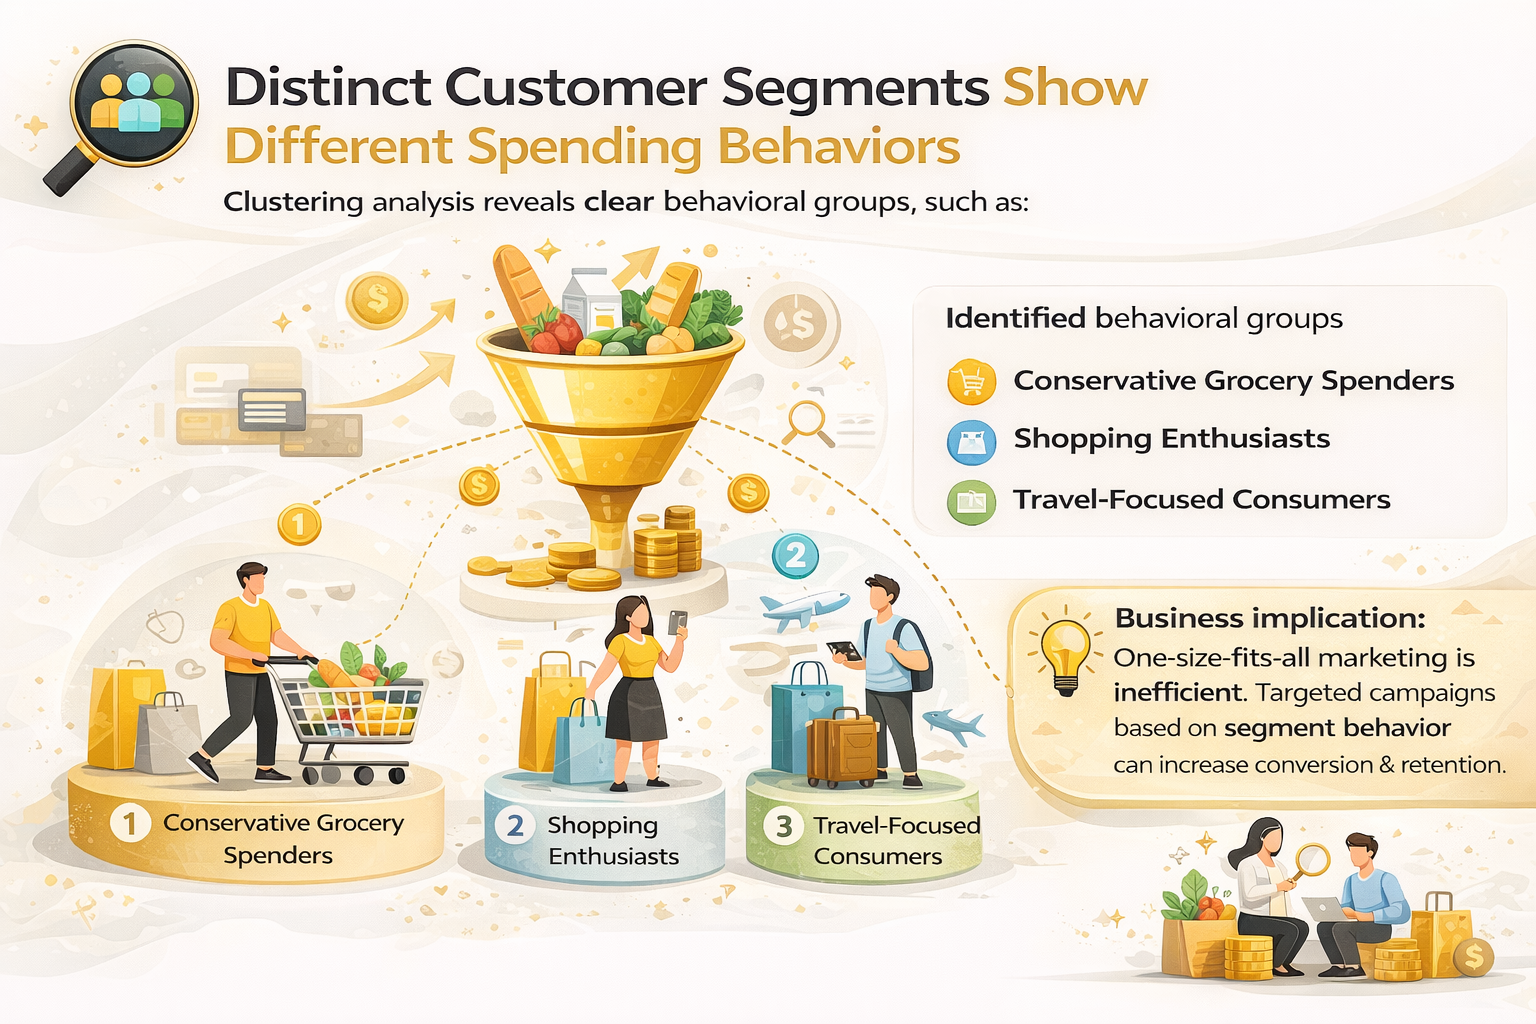
K-MEANSGrouped customers into meaningful segments based on similarities in their spending behavior.
Discover
APRIORIIdentified relationships and associations between customer spending categories.
Forecast
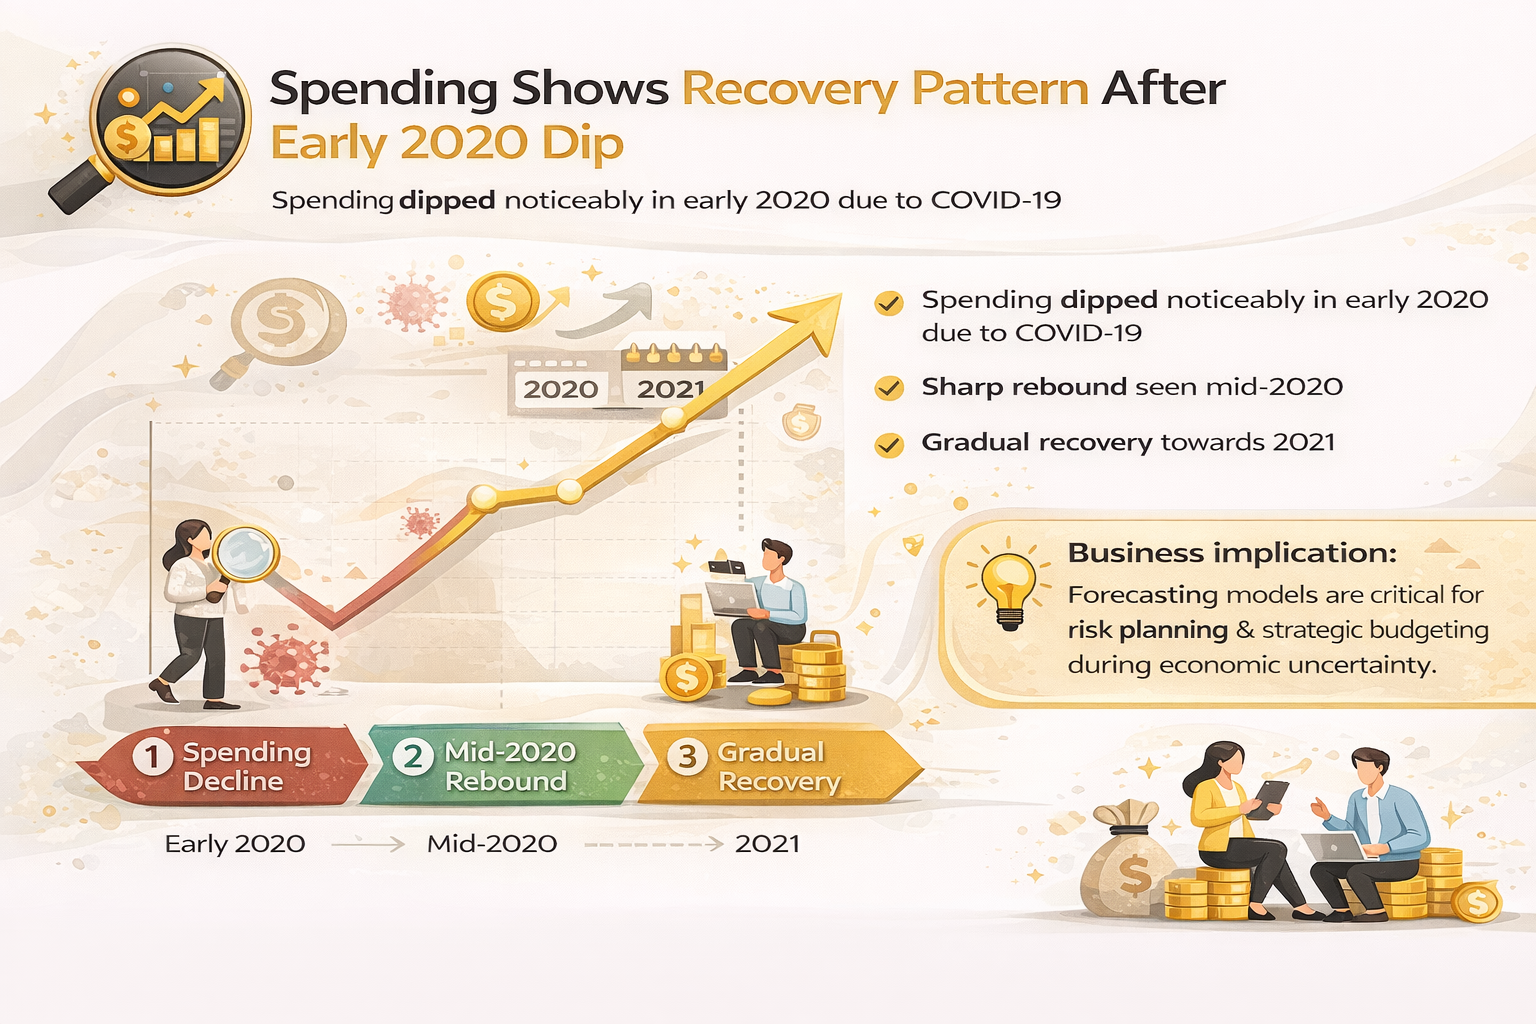
ARIMAModeled historical patterns to understand future spending behavior and seasonal movement.
What the Data Revealed
Key behavioral patterns discovered across spending categories, demographics, income levels, generations, and time.
Spending by Category
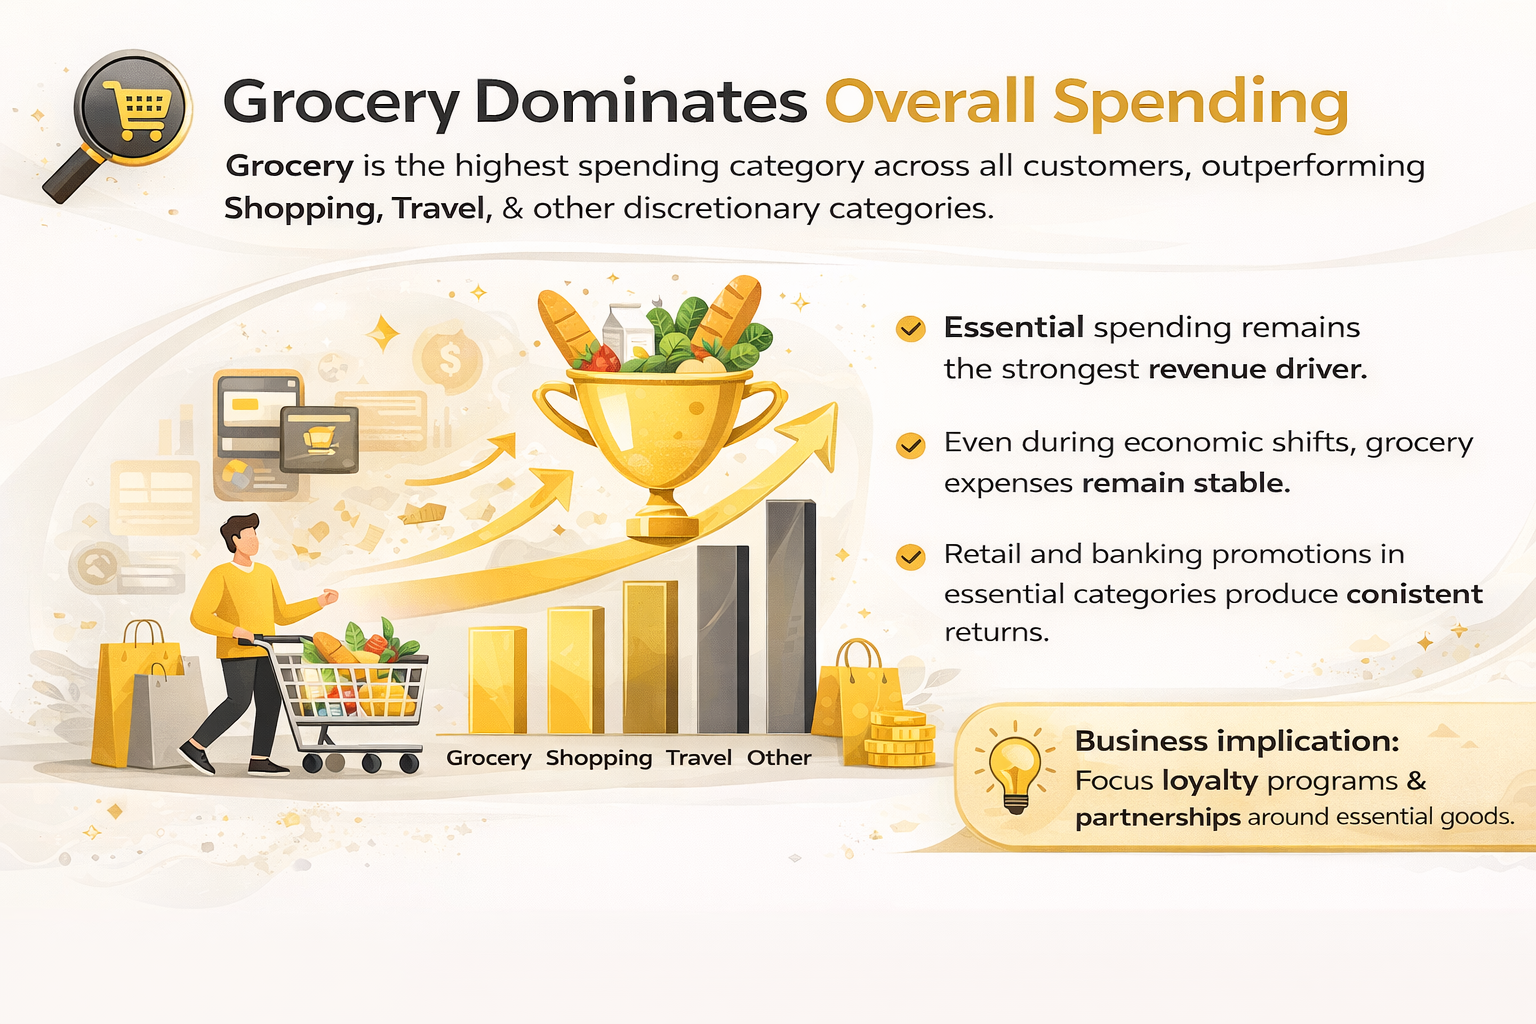
Insight: Grocery represents the highest spending category, highlighting the dominance of essential purchases.
Spending by Gender
Insight: Female customers account for approximately 55% of observed total spending.
Average Spending by Salary
Insight: Lower-income segments demonstrate relatively high average credit-card spending.
Spending by Generation
Insight: Millennials and Gen Z show the highest average spending among the observed generations.
Spending Trend Overview
Insight: Spending patterns fluctuate over time, revealing seasonal changes that can support forecasting and financial planning.
From Data to Decisions
Behavioral transaction data becomes most valuable when the findings are translated into practical business actions.
Smarter Targeting
Replace generic campaigns with behavior-based targeting tailored to the spending priorities of each customer segment.
Better Retention
Use customer segments to design personalized loyalty strategies based on real purchasing behavior.
Plan Ahead
Forecasting enables organizations to anticipate changing spending patterns and seasonal demand.
Optimize Revenue
Prioritize valuable customer groups and high-frequency categories to improve marketing efficiency.
Data becomes valuable when it leads to better decisions, not just better reports.
By combining customer segmentation, association analysis, and forecasting, this project demonstrates how transaction data can support smarter targeting, stronger customer retention, more informed planning, and better revenue decisions.